This search combines search strings from the content search (i.e. "Full Text", "Author", "Title", "Abstract", or "Keywords") with "Article Type" and "Publication Date Range" using the AND operator.
Beilstein J. Nanotechnol. 2023, 14, 83–94, doi:10.3762/bjnano.14.10
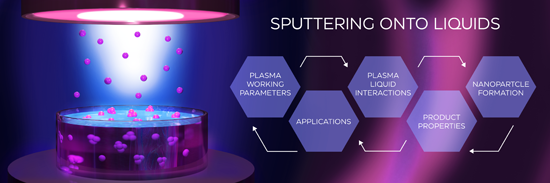
Figure 1: (a–c) Plan view and (d–f) cross-section SEM images of the Ag–Al alloy thin film with an initial com...
Figure 2: (a–d) Plan view and (e–h) cross-section SEM images of the Ag–Al alloy thin film with an initial com...
Figure 3: (a–c) Plan view and (d–f) cross-section SEM images of the Ag–Al alloy thin film dealloyed for 60 mi...
Figure 4: (a) Aluminium content evaluated by EDX for samples dealloyed in 1 wt % of HCl and for an initial Ag...
Figure 5: (a–c) Plan view and (d–f) cross-section SEM images of the Ag–Al alloy thin film dealloyed for 60 mi...
Figure 6: (a–c) Plan view and (d–f) cross-section SEM images of the Ag–Al alloy thin film dealloyed for 60 mi...
Figure 7: Evolution of the (a) ligament size and (b) aluminum residue for samples with different initial silv...
Figure 8: (a) Raman spectra recorded after 24 h of incubation in a RhB solution for different concentrations ...
Beilstein J. Nanotechnol. 2022, 13, 10–53, doi:10.3762/bjnano.13.2
Figure 1: Growth of research interest in the SoL approach. Insert: Number of SoL-related publications in the ...
Figure 2: Summary of the different types of synthesis methods to produce NPs.
Figure 3: (a) Schematic representation of a (magnetron) sputtering deposition chamber along with some key set...
Figure 4: SRIM calculation of the sputtering yield of C (black disks), Ti (grey squares), and Au (white trian...
Figure 5: (a) Evolution of the castor oil (4 g) temperature as a function of time, at 5 and 10 mm from the bo...
Figure 6: Schematic diagrams representing the NP formation as a function of time: (a) La Mer model and (b) au...
Figure 7: Schematic representation of the secondary growth processes.
Figure 8: TEM images and corresponding size distributions of Pt NPs produced via MS of a platinum target onto...
Figure 9: Statistics data of the most commonly used (a) host liquids and (b) target materials for the SoL app...
Figure 10: (a) Average diameters of Ag NPs as a function of the viscosity of PEMP controlled by temperature. Figure 10a ...
Figure 11: Schematic representation of NP and film growth during the SoL process.
Figure 12: In situ UV–vis spectra for the reduction of 4-nitrophenol using Au NPs in DES solution after sputte...
Figure 13: Schematic illustration of multilayer films made of (a) AuNPs/[poly(sodium 4-styrenesulfonate) (PSS)...
Figure 14: (a) Schematic illustration of the sputtering equipment (left) without α-thioglycerol and (right) wi...
Figure 15: Photoluminescence spectra of Au, Ag, and Cu nanoclusters in (11-mercaptoundecyl)-N,N,N-trimethylamm...
Figure 16: (a) HRTEM images with FFT and (b) photographs of the antibacterial disc of the PEGylated Au NPs pre...
Figure 17: (a) Schematic illustration of Au/Ag binary targets with different gold fractions (fAu). (b) Photogr...
Figure 18: Schematic overview of the different routes used to synthesize amorphous and crystalline Cr/Mn/Fe/Co...
Figure 19: Au L3 EXAFS data for an Au metallic foil (reference) and Au/Pd alloy NPs with different Au/Pd ratio...
Figure 20: (a) Left: schematic of the co-sputtering process into a cavity array substrate filled with an IL. R...
Figure 21: (a) Photograph of solutions containing alloy NPs obtained with different applied currents on Au and...
Figure 22: (a) Schematic of the strategy used to evaluate the intrinsic activity of alloy NPs. More details ca...
Figure 23: PL spectra with (a) excitation and (b) emission of Au NPs, Ag NPs, and Au/Ag alloy NPs. Figure 23 was adapte...
Figure 24: (Left) Schematic of the sequential sputtering of Pt over Au NPs stabilized on a functionalized ILs ...
Figure 25: (a) Schematic of the process used for the synthesis of a noble metal (M) core with an In2O3 shell (...
Figure 26: (a) Cyclic voltammograms of Pd/Au bimetallic NPs film in KOH solution. (b) Relationship between pea...
Figure 27: (a) TEM image with the corresponding EDS spectrum, (b) HRTEM image, and (c) HAADF-STEM image with E...
Figure 28: (a) Left: HAADF-STEM images of Pt/Ni NPs on MWNTs with the corresponding EDS mapping of Pt and Ni. ...
Figure 29: (a) Schematic of the process used for the preparation of Pd/Au NP–TiO2 nanocomposites by successive...
Figure 30: (a) Schematic of the process used for the preparation of resins containing Au NPs. (b) UV–vis trans...
Beilstein J. Nanotechnol. 2016, 7, 1361–1367, doi:10.3762/bjnano.7.127
Figure 1: (a) Scheme of the fabrication process developed in this work to prepare metallic nanowire arrays wi...
Figure 2: AFM images of substrate and the corresponding SEM micrograph after deposition of 220 nm of metal. T...
Figure 3: SEM images after (a,b) 30, (c,d) 220 and (e,f) 360 s of deposition time of copper. (g) Evolution of...
Figure 4: Schematic illustrating the different formation stages of hillocks during the deposition of a metal ...
Figure 5: Influence of the dealloying voltage on the formation of gold–copper with a bubbled morphology. SEM ...